Market Update: 22 Jan 2020
The broad price puke from yesterday has been blamed on some negative headlines out of Biden’s new “crypto unfriendly” administration. However, we think that the market was already due for a correction. So while the headlines might have dampened bullish sentiment, we are not making changes to our trading plan just yet. We’ve always been most worried about the US regulatory hammer from this new administration — but Yellen’s & Powell’s remarks on crypto regulation sounded less draconian than we had initially feared, although many observers seemed to have been taken by surprise by it.
We think this dip is largely the result of market positioning. Long crypto has been become a crowded consensus trade and a correction was bound to happen, the negative headlines were just an excuse for longs to unwind. In our New year update (Point 10), we highlighted how BofA Hartnett’s widely followed Wall street survey would soon show BTC as the highest consensus trade, and that the last time this happened was the 2017 BTC top. This week’s publication on Tuesday officially showed BTC overtaking US Tech as the hottest consensus trade in the market. While we’re not at all expecting a crash similar to 2018 this time, we see this as further evidence that the exponential Wave 3 move has ended and price is likely to be capped at least until the end of Q1. As such we are sticking to our short strangle strategy at the key 20k & 52k levels.
Signs of institutional exhaustion:

We’ve done a timezone analysis which breaks down BTC moves into Asia hours vs. US hours (12 hours each). Since March last year, the clear pattern has been relentless US buying while Asian whales and miners have been on the offer. However after the BTC top 2 weeks ago, the strength in US hours has lost momentum for the first time. This is a clear sign of exhaustion in demand from the US institutions and corporates who have been the primary drivers of this bull run (Chart 1).
Weakening of retail fervour:

We pay close attention to weekend price action and the leveraged perp funding rates to gauge retail interest. The exponential move higher in the last few weeks of the Dec was marked by strong weekend price gains which created strong momentum into the week. Jan 09 and 10 this year was the first weak weekend in awhile and also marked the recent high. So pay close attention to price action in the coming weekends (Chart 2). Looking at leveraged funding rates, all price dips this year were followed by a surge in funding as retail rushed in to buy dips. However, last night funding turned negative instead — a sign to us that the retail demand (at roughly US$10bn BTC open interest & US$3.2bn ETH open interest) has lost some strength as price stagnates (Chart 3).

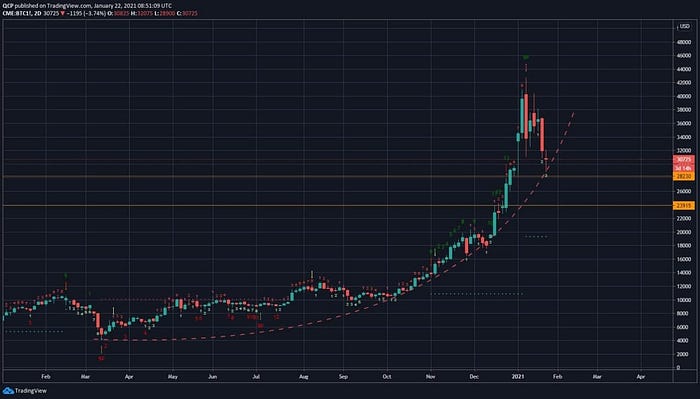
In the near-term, we’re expecting a key battle at the 30k spot level and are waiting to see how much US can come in and lift us into the close tonight. This battle for the 30k weekly close will be key. On CME we still have the two-day 9–13–9 demark signal capping the price top and possibly marking the end of Wave 3, but the parabolic support will determine how quickly we break lower or if we continue to bounce around in a wider Wave 4 range here. Today’s low around 28k on CME is the level to watch as that also marks the big weekly gap level and parabolic support (Chart 4).
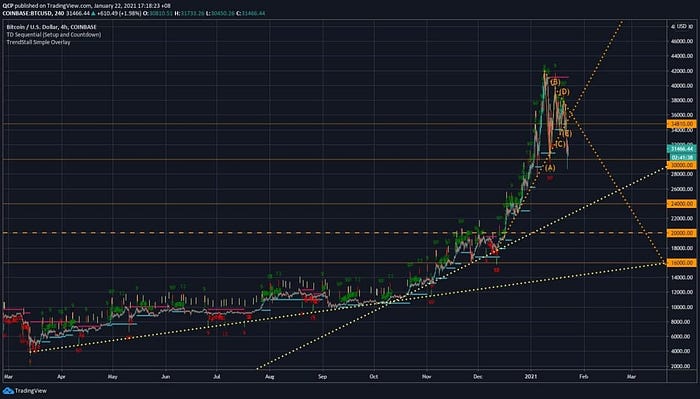
On this whole run higher, spot exchange flows, particularly demand out of Coinbase US, have been providing strong support. Overnight this support was lacking and BTC broke through the first trendline at 35k. Should this move extend lower we look towards the lower trendline at 24k as our next big support level, followed by the big 20k breakout level (which most institutions are leaning against) and our final line in the sand at 16k (Chart 5). The 30k level is now the immediate bull/bear line, while 20k will probably find significant support.
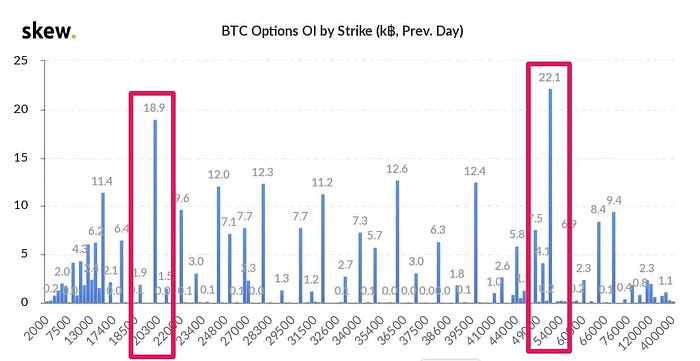
In options, we can see the market’s implicit strangle at 20k & 52k (Chart 6), and we see no reason to stop selling these strikes. For us we prefer keeping our puts longer-dated and lower delta right now at the 24k, 20k and 16k level; while keeping our calls tactical, short-dated and higher delta up till Mar-end at the 36k, 40k, 48k & 52k strikes.
The alternating wave rule means that this current Wave 4, which we expect to be a classic Elliot wave zig-zag, would not be as deep and sharp as the Wave 2 that ended with Black Thursday in March last year, but rather have sharp oscillating moves within correction which would be shallower but longer. Therefore we are aiming to capture the decay in this sideways move while extracting further alpha especially from trading the spot range around these levels. However, we remain bullish in the medium term, selling more puts than calls and trading spot with an upside bias as we expect a wave 5 higher that will break the highs again after this consolidation period.
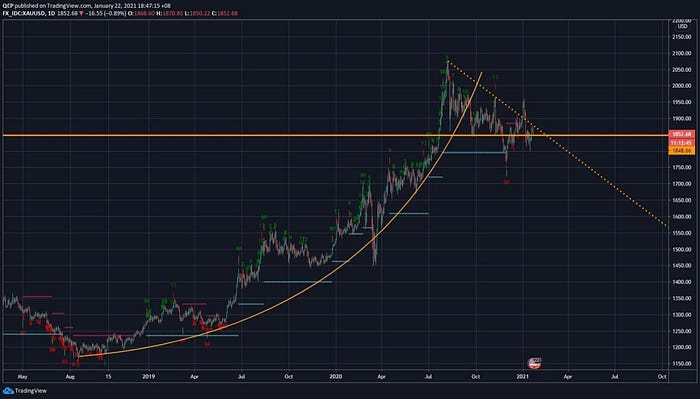
Disappointment over the ECB last night was also partly to blame for this move — other key liquidity proxies such as Gold took a further hit as it continues playing out its own extended Wave 4 zig-zag correction (Chart 7).
After the mini taper tantrum last week on the back of hawkish taper comments from typically dovish Fed officials and the ECB (who are usually proactive) standing pat last night, it is clear that central banks are firmly in a wait & see mode, paying close attention to changes in economic data as the Covid vaccine gets deployed worldwide.
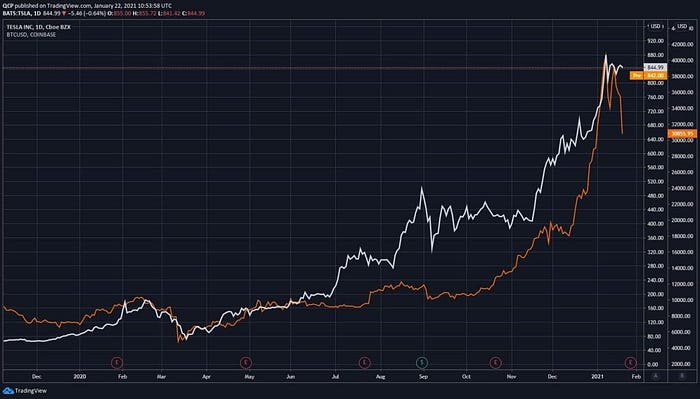
The absence of central bank signals will be a bane for pure liquidity proxies such as BTC and Tesla (which to us is as good a liquidity proxy as BTC). We are watching for a significant reversal in Tesla which has also been the poster child for BofA’s next most consensus US Tech trade (Chart 8: BTC vs TSLA). A coordinated move lower by BTC, Gold & Tesla will signal to us a liquidity worry for the market.